Download presentation
Presentation is loading. Please wait.

1
천문학자가 보는 기후 이야기 2 충남대학교 천문우주과학과 이 유

2
Contents Motivations Earth Magnetic Pole Shift Conclusion
Global Warming in the Media Global Warming Observed Global Warming Unexplained Earth Magnetic Pole Shift Conclusion Hypothesis Suggested

3
반기문 총장 , 뜨거워진 남극 방문(동아일보 ) 유엔이 선정한 ‘지구의 해’를 맞아 반 총장은 유엔 총장 자격으로는 최초로 남극을 방문했다. 남극은 지난 50년간 지구온난화로 가장 급격한 변화를 겪고 있는 곳. 반 총장은 빙하가 녹는 광경을 보고 “흠 없이 완전한 빙하를 하나도 찾을 수 없다”며 안타까워했다.

4
Polar ice and glaciers will melt
Polar ice and glaciers will melt. The Arctic sea ice could disappear completely within five years

5
Sea level will rise up to 20 feet by 2100

6
Hurricanes and their intensity will increase.

7
The rapidly changing climate will threaten species with extinction

8
Global Warming Observed

9
Global Warming Observed

10
Global Warming Observed

11
Arctic Sea Ice

12
Global Warming Hypotheses
Urban Heat Island (UHI)- Local Anthropogenic Global Warming (AGW) Natural Forcings (Solar, Geophysical ….)
- Local. Anthropogenic Global Warming (AGW) Natural Forcings (Solar, Geophysical ….)")
13
도시 열섬 효과 (Urban Heat Island Effect)
")
14
Profile of Annual Mean Surface Temperature at KMA
Intro 2/3 Profile of Annual Mean Surface Temperature at KMA 한반도의 경우, 기상청에서 제공하는 서울의 약 100년간의 연평균 온도를 보면, Noaa의 결과와 비슷하게 증가하지만, 최근 2000년 이후에는 전세계평균기온과 달리 감소하는 경향을 보이고, 추풍령의 경우 거의 온도변화가 없었습니다. 그래서, 한반도 다른 관측소들의 기온변화 경향을 분석하고자 연구를 진행하게 되었습니다.

15
Urban Station Seoul Data 2/5
먼저 도시 지역에 위치한 관측소의 지도를 보면, 녹색 화살표 지점이 서울 기상관측소가 위치한 곳 입니다. 서울은 대표적인 도시지역으로 관측소 주변에 많은 건물이 있음을 볼 수 있습니다.

16
Rural Station Chupungnyeong Data 4/5
1. 다음은 시골 지역의 지도 입니다. 현재 보시는 지도는 산과 논,밭이 대부분을 이루고 있는 추풍령 지역으로 초록색 표식이 가르치는 곳이 추풍령 기상관측소입니다. 16

17
Temperature profile for 4 Urban Stations
Result 6/11 Temperature profile for 4 Urban Stations 다음은 대구, 강릉, 서울, 수원 지역의 연평균기온의 5년 가중이동평균값 프로파일입니다. 점선이 표시된 시점들은 앞에서 보여드린 시골지역의 그림에 표시된 것과 같은 시점들 입니다. 도시지역도 시골지역과 비슷하게 연평균 온도 상승시기와 하강 시기가 일정한 pattern 보입니다도시별로 상승 추세에 대한 차이는 있지만 시골보다는 큰 상승 추세를 알 수 있습니다. 17

18
Temperature profile for 4 Rural Stations
Result 5/11 Temperature profile for 4 Rural Stations 1970년부터 2010년까지 시골 지역의 연평균기온의 5년 가중이동평균값 profile입니다. 점선이 표시된 곳을 보면 네 지역 모두 온도가 상승하고 하강하는 것이 비슷한 추세를 가지고 있는 것을 확인할 수 있습니다.

19
Urban Heat Island (UHI) Anthropogenic Global Warming
Intro 3/3 Previous Studies on temperature change in Korea Urban Heat Island (UHI) UHI > 50 % UHI (20%~50%) MyeongIn Lee, InSik Kang(1997) - Korea mean warming: 0.47℃ - Urban warming: 0.3℃ MaengKi Kim(1999) - Korea mean warming: 0.6 ℃ Urban warming: 0.4℃ Greenhouse effect: 0.2 ℃ Chung Y.S and M.B Yoon (1999) - Korea mean warming: 0.96℃ - Urban warming: 1.58℃ NIMR(2004) - Urbanization effect: 20 ~ 30 % KyungJa Ha(2004) - Seoul(44.8%), Daegu(31.8%) Busan(18.5%) Choi(2003) - Korea mean warming: 1.17℃ - Urban warming: 0.41℃ (35%) GyoSook Koo(2007) - (H)Korea mean warming: 1.22℃ - (H)Urban warming:0.35 ℃ - (L)Korea mean warming: 1.13℃ - (L)Urban warming:0.44 ℃ Anthropogenic Global Warming KMA (2009, Report) - Korea Temperature( ) : 1.7℃ increase NIMR, 2008 Boo et al., 2006 - A1B Scenario: ( ) - ( ) : Korea temperature: 4 ℃ 도시화 효과와 온실 효과에 대한 선행 연구를 살펴보면, 1990년대 후반의 논문은 전체 온도 상승률에 대해 도시화 효과에 의한 상승이 50% 이상을 차지하고 있다는 결과를 보고하고 있으며 2000년대 이후의 논문에서는 도시화 효과에 대한 온도 상승이 1990년 후반 보다 조금 줄어든 20% ~ 50% 사이라고 주장하고 있습니다. 또한, 온실가스에 의한 온난화 효과에 대한 연구는 2009년도 기상청 보고서에서 지난 100년간 한반도 평균기온은 1.7도 상승하였다고 하였습니다. 기상연구소의 A1B 시나리오는 온실가스 농도가 증가할수록 기온이 상승하는 경향에 따르며 20세기말 대비 21세기말 기온변화는 한반도 전 지역에 대하여 4도 정도 상승할 것이라 하였습니다.
 UHI > 50 % UHI (20%~50%) MyeongIn Lee, InSik Kang(1997) - Korea mean warming: 0.47℃ - Urban warming: 0.3℃ MaengKi Kim(1999) - Korea mean warming: 0.6 ℃ Urban warming: 0.4℃ Greenhouse effect: 0.2 ℃ Chung Y.S and M.B Yoon (1999) - Korea mean warming: 0.96℃ - Urban warming: 1.58℃ NIMR(2004) - Urbanization effect: 20 ~ 30 % KyungJa Ha(2004) - Seoul(44.8%), Daegu(31.8%) Busan(18.5%) Choi(2003) - Korea mean warming: 1.17℃ - Urban warming: 0.41℃ (35%) GyoSook Koo(2007) - (H)Korea mean warming: 1.22℃ - (H)Urban warming:0.35 ℃ - (L)Korea mean warming: 1.13℃ - (L)Urban warming:0.44 ℃ Anthropogenic Global Warming. KMA (2009, Report) - Korea Temperature( ) : 1.7℃ increase. NIMR, 2008 Boo et al., A1B Scenario: ( ) - ( ) : Korea temperature: 4 ℃ 도시화 효과와 온실 효과에 대한 선행 연구를 살펴보면, 1990년대 후반의 논문은 전체 온도 상승률에 대해 도시화 효과에 의한 상승이 50% 이상을 차지하고 있다는 결과를 보고하고 있으며. 2000년대 이후의 논문에서는 도시화 효과에 대한 온도 상승이 1990년 후반 보다 조금 줄어든 20% ~ 50% 사이라고 주장하고 있습니다. 또한, 온실가스에 의한 온난화 효과에 대한 연구는 2009년도 기상청 보고서에서 지난 100년간 한반도 평균기온은 1.7도 상승하였다고 하였습니다. 기상연구소의 A1B 시나리오는 온실가스 농도가 증가할수록 기온이 상승하는 경향에 따르며 20세기말 대비 21세기말 기온변화는 한반도 전 지역에 대하여 4도 정도 상승할 것이라 하였습니다.")
20
Result 8/11 지난 100년간의 서울과 추풍령, 목포, Central England 겨울 기온 프로파일을 소개하면, 적색 점은 2010년, 2011년 겨울기온입니다. 모든 곳에서 2010년, 2011년 겨울이 더 추웠음을 볼 수 있었고 특징적인 것은 1980년 이후에 크게 증가하다가 1990년 이후 20년 동안 기온상승이 일어나지 않는 saturation된 형태를 보이는 것이었습니다. 이것은 한반도 전 관측소에서 나타나는 공통적인 현상이며 현재 350년의 가장 오래된 관측 기록을 갖고 있는 central England의 온도 변화에서도 같은 경향성을 볼 수가 있습니다.

21
IPCC Reports : vs

22
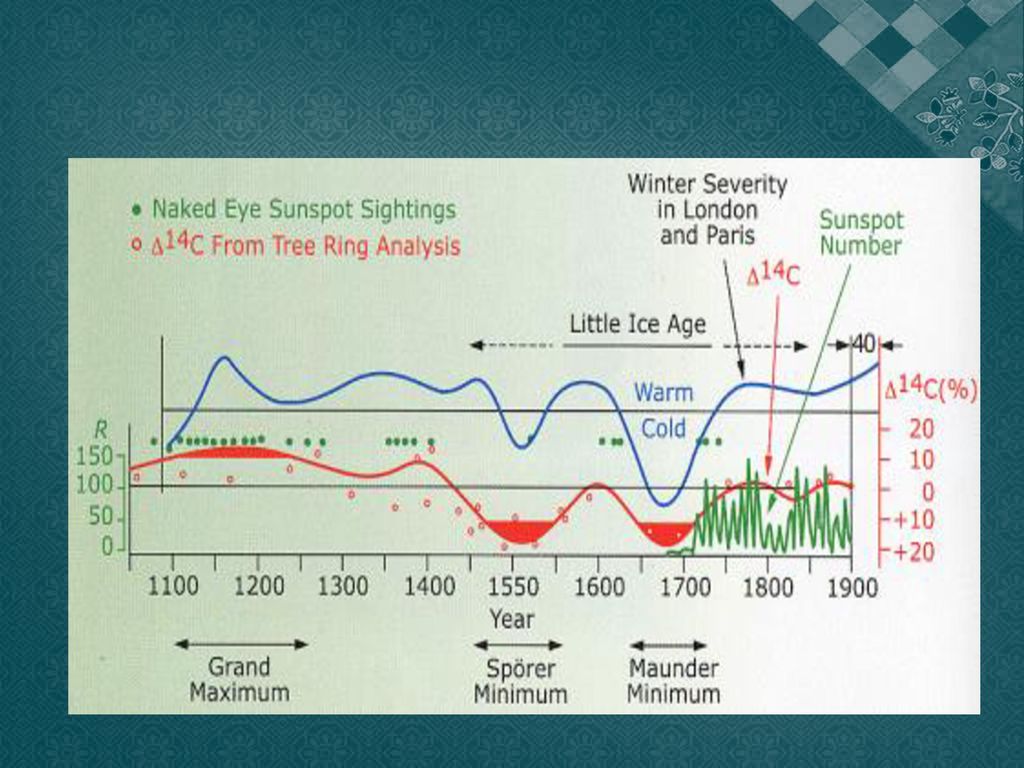
Climate History We are in an 11,000 year interglacial period called the Holocene. It has been warmer than today quite a few times in this period.

24
Global Warming Unexplained

25
Arctic Sea Ice

26
Antarctic Sea Ice

27
Global Warming Unexplained

28
Global Warming Unexplained

29
Global Warming Unexplained

30
Global Warming Unexplained

32
The international ARGO project to provide profiles of ocean temperature and salinity as well as ocean currents to depths of around 2000 metres, as vital support to global climate studies

33
How ARGO floats work

34
Global Warming Unexplained
The intensity of this light decreases rapidly with water depth, for example, only 73% of the surface light reaches a depth of 1 centimeter only 44.5% of the surface light reaches a depth of 1 meter 22.2% of the surface light reaches a depth of 10 meters 0.53% of the surface light reaches a depth of 100 meters 0.0062% of the surface light reaches a depth of 200 meters Bottom line -- most of the light is absorbed or scattered within the top few meters of the ocean. Indeed by 100 to 200 meters deep, virtually all of the solar radiation has been absorbed......remember that the abyssal plains, which cover the vast majority of the ocean basin, are between 4000 and 5500 meters deep, consequently the vast majority of the ocean is dark and cold!!!. The minimum energy supply necessary to maintain photosynthesis is cal per cm2. Under most conditions this level of energy, and therefore photosynthesis, is only available to the upper 200 meters of the sea.

35
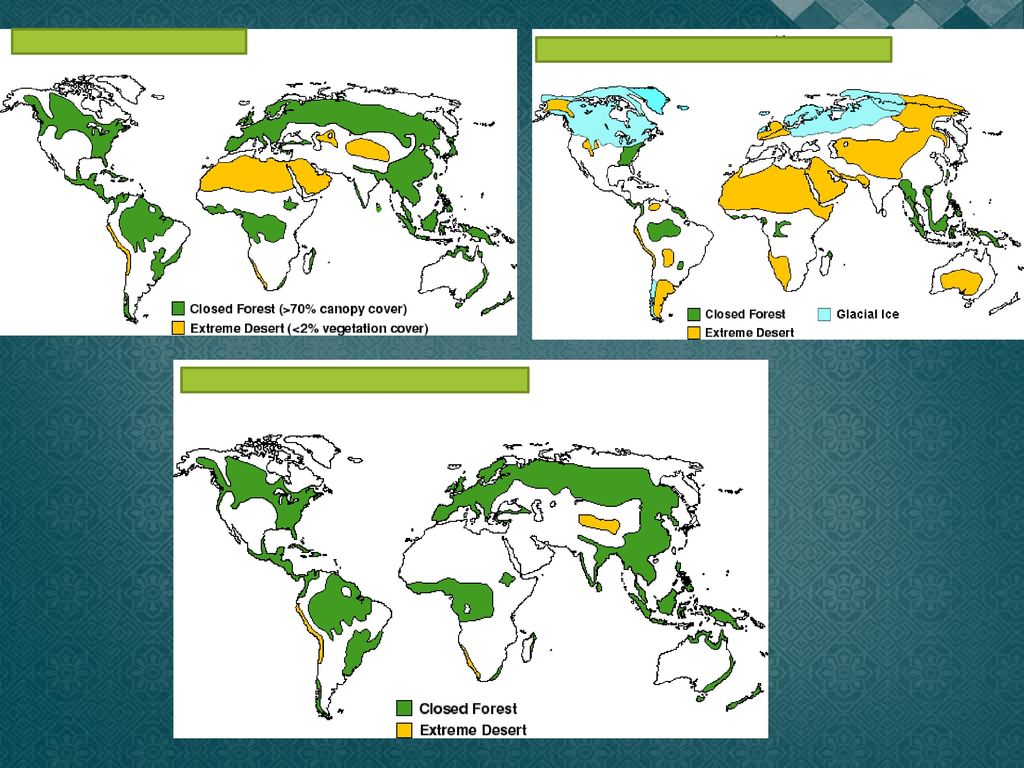
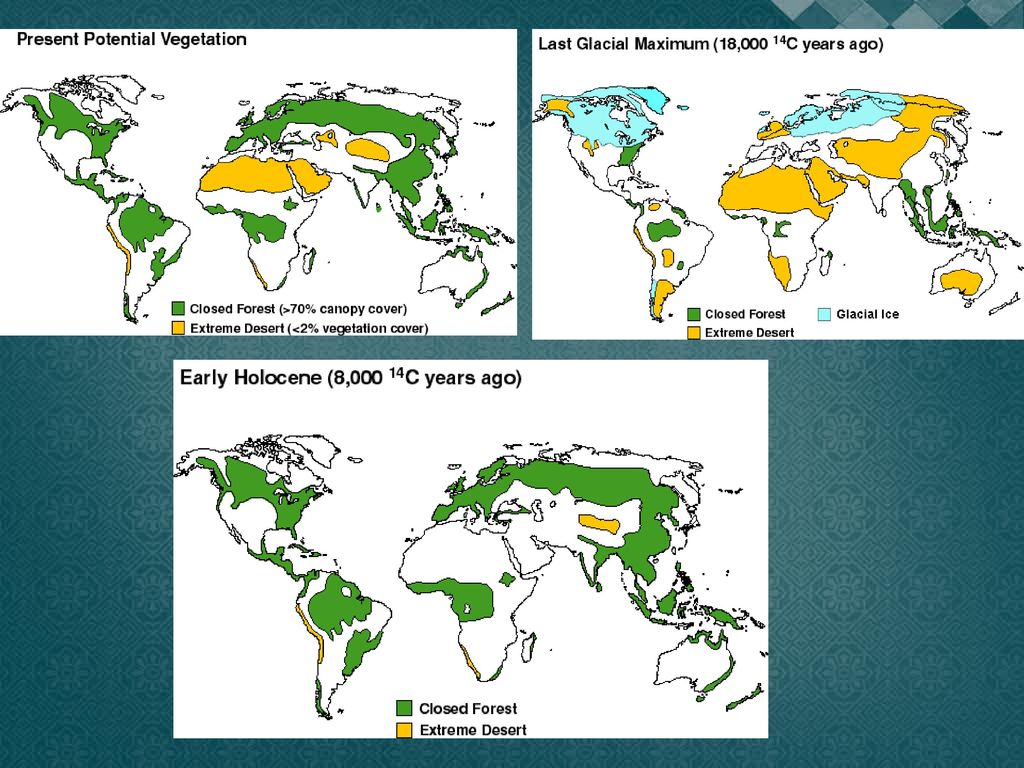
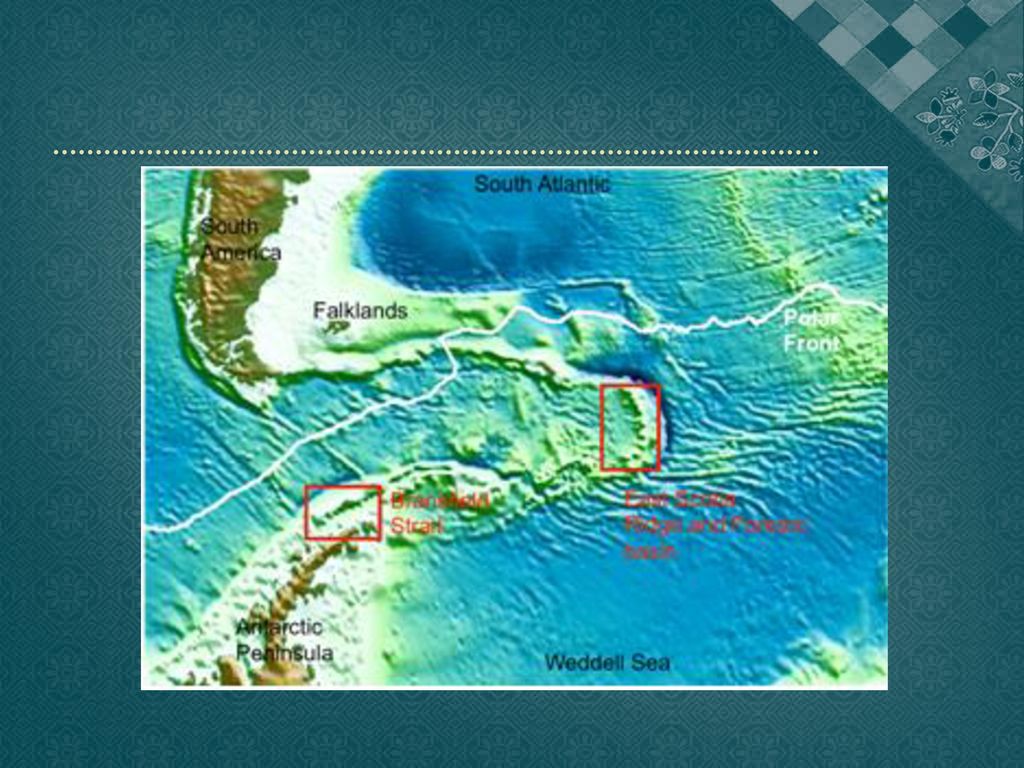
Climate Geography

38
Earth Magnetic Pole Shift

39
CO2makes up 3. 62% of greenhouse gases. But only 3
CO2makes up 3.62% of greenhouse gases. But only 3.4% of atmospheric CO2 comes from human sources, the rest is from the oceans, decomposing vegetation and volcanoes. Thus man made sources of CO2 are only responsible for 0.15% of all greenhouse gases in the atmosphere.

40
Earth Magnetic Pole Shift

41
Earth Magentic Field Variation Credit: GFZ/Credit: Mandea et al. www
Earth Magentic Field Variation Credit: GFZ/Credit: Mandea et al. Maps of the vertical downward component (sign-changed radial component) of the core magnetic field (A) and its secular variation (B) as estimated at the CMB from the GRIMM-3 model up to spherical harmonic degree 13
 of the core magnetic field (A) and its secular variation (B) as estimated at the CMB from the GRIMM-3 model up to spherical harmonic degree 13.")
42
Hydrothermal Vent

43
Hydrothermal Vent Flora

44
Hydrothermal Vent Fauna

45
Hydrothermal Vent

46
Hydrothermal Vent

47
Hydrothermal Vent

48
Hydrothermal Vents

50
El nino & La nina

51
El nino & La nina

52
Arctic Sea Ice

53
Conclusions The recent acceleration of earth magnetic pole shift might be associated with the ocean heating, which can not be explained by AGW hypothesis. Hypothesis : The hydrothermal vents and other undersea volcanic activities might be the heat sources of ocean and even atmosphere. Their activities might be driven by the tectonic movement of the plate, which is influenced by flow systems inside the earth. It might be estimated by global network of the ground magnetometers.

54
Nullius in Verba Latin for "Take nobody's word for it",
The motto of the Royal Academy acting as the United Kingdom's Academy of Sciences If the AGW scenario fails, the end of the modern science era led by the UK may come.

55
KISTI 에 제안 시뮬레이션 전문가 분야별 DB 구축 연구자 Networking KISTI 주관 능동적 연구과제 공모
시뮬레이션 연구 지원

Similar presentations
 란 … 지구온난화를 일으키는 주범과 출처 지구온난화의 현주소 지구온난화로 인한 생태계의 파괴 지구온난화로 인한 인간의 피해 시행되고 있는.>")
, 40 억년 전 식어 단단해 진 지구, 37 억년 전 짠 맛의 바다 탄생,... 지구의 탄생 후 1)>")
 인제대학교 컴퓨터시뮬레이션학과 명 연수.>")
Sartre 의 존재와 무 : Sartre 의 존재는 의식하는 인간으로서의 존재 사전에 정해진 구속된 존재가 아닌, 시대와 타자와의 관계 속에서 스스로를 느끼며.>")
 – 남아메리카의 근해에서 거의 매년 초에 나타나는 적도 태평양이 비정상적으로 따뜻해지는 것으로 스페인어로 'The Little Boy' 또 는 'Christ Child' 를 의미하며 이 현상이 크리스마스 때에 나타나는.>")


 지구 온난화의 대책 ( 국민 )>")


 지구의 중력장과 측량 오차 1) 지구의 중력장과 측량 오차 수선의 기울어짐 ( 산맥의 영향 ) - 이론치보다 작음 ( 산맥 뿌리의 영향 ; Airy)>")


