Download presentation
Presentation is loading. Please wait.

1
R commander an introduction user-friendly and absolutely free
Ho Kim SCHOOL OF PUBLIC HEALTH, SNU

2
Installing R commander ①
You need to first install R and then R commander.

3
Installing R commander ②
Write on R console window like install.packages(“Rcmdr”)
")
4
Starting the R commander
library(Rcmdr)
")
5
R commander windows Script window Output window Messages window

6
Importing datasets

7
Select the data set by clicking on this box

8
Checking continuous variables
Statistics->Means options Single-sample t-test Independent samples t-test Paired t-test One-way ANOVA Multi-way ANOVA

9
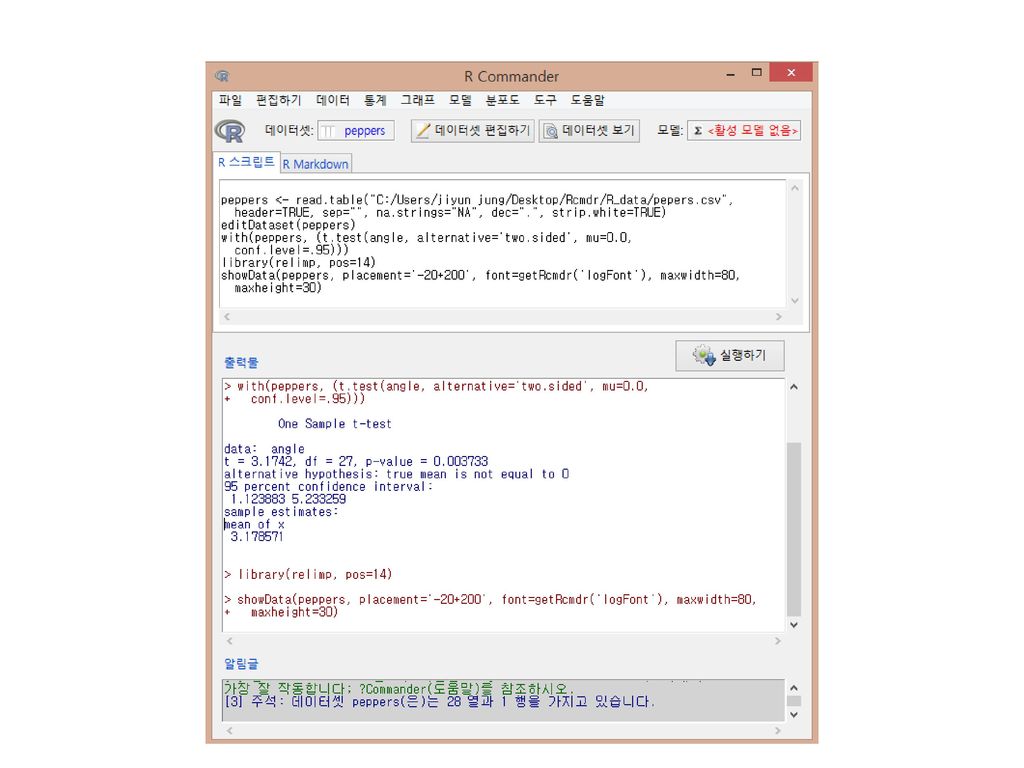
문제 1. 1.1 Pepers.xls 자료를 읽고 angle 변수의 평균이 0인지를 검정하시오. 귀무가설과 대립가설이 무엇인지를 식으로 정확히 표현하시오.

10
single-sample t-test (Pepers.xls)
Statistics > Means > Single-sample t-test (Enter the proposed mean (Null hypothesis: mu=))
)")
12
1.2 angle 변수의 평균이 2라고 이미 알려져있다고 가정하고 이 자료를 가지고 기존의 지식이 사실이 아니라는 것을 주장하고 싶다면 어떠한 분석을 실시할 수 있는지 귀무가설과 대립가설을 써 보시오. * 위 검정을 R commander를 이용해서 분석하고 결론을 내리시오.

13
single-sample t-test (Pepers.xls)
Statistics > Summaries > Shapiro-Wilk test of normality This is a hypothesis tests with the null hypothesis that the data comes from a normal distribution.

14
문제 2. 2.1 Pulse.xls 자료를 읽고 pre와 post 변수를 볼 때 어떠한 분석을 실시해야 하는지 설명하시오.
* 귀무가설과 대립가설이 무엇인지를 식으로 정확히 표현하시오. 2.2 위의 가설을 모수적인 방법, 비모수적인 방법으로 증명하고자 할 때 R commander를 이용해서 분석하시오. 그리고 통계적 결론을 내리시오.

15
paired t-test(parametric)
- Pulse data paired t-test(parametric) Import the data
 Import the data.")
16
paired t-test(parametric)
- Pulse data paired t-test(parametric) Statistics > Means > Paired t-test
 Statistics > Means > Paired t-test.")
17
paired t-test(parametric)
- Pulse data paired t-test(parametric)
")
18
paired t-test(non-parametric)
- Pulse data paired t-test(non-parametric) Statistics > nonparametric tests > Paired-samples Wilcoxon test
 Statistics > nonparametric tests > Paired-samples Wilcoxon test.")
19
paired t-test(non-parametric)
- Pulse data paired t-test(non-parametric)
")
20
문제 3. 3. 1 insul. xls 자료를 읽고 이 자료의 분석 목적에 대해서 설명하시오. 3
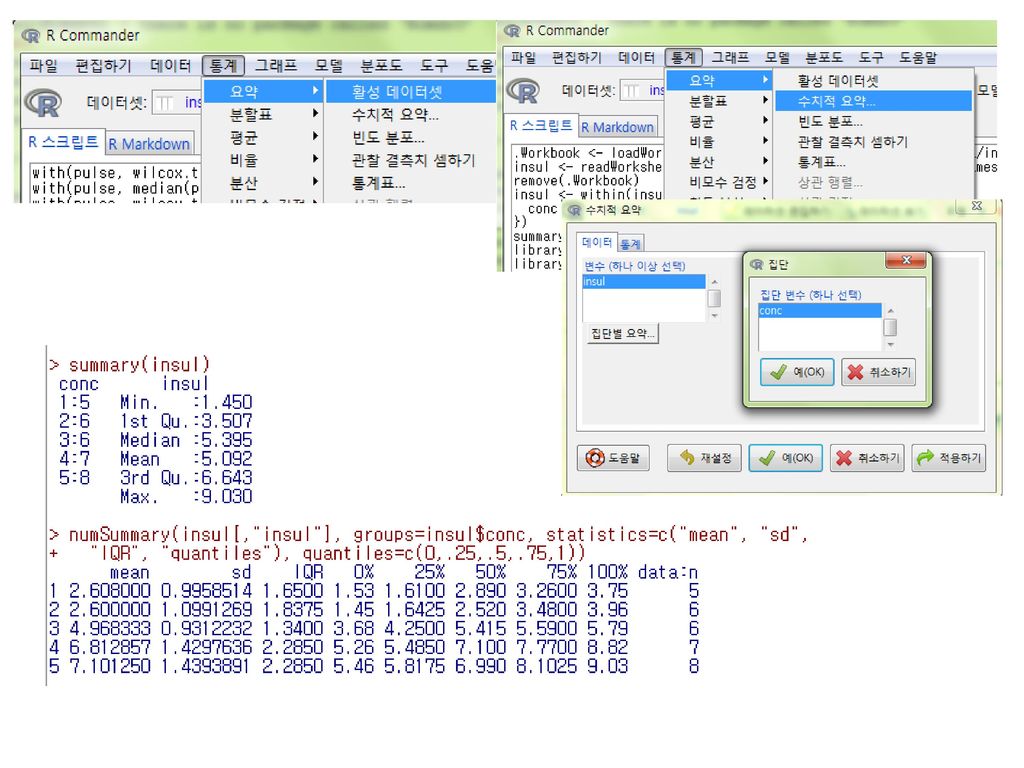
문제 insul.xls 자료를 읽고 이 자료의 분석 목적에 대해서 설명하시오. 3.2 자료의 탐색 (Statistics>Summaries)을 R commander를 이용해서 실시하고 결과를 해석하시오 군의 glucose값을 비교한다면 귀무가설과 대립가설이 무엇인지를 식으로 정확히 표현하시오. 3.4 R commander를 이용한 ANOVA를 실시하고 그 결과를 해석하시오. 3.5 사후분석을 실시해서 군간의 차이를 설명하시오 3.6 conc=1,2 를 한 그룹으로 conc=4,5 를 다른 그룹으로 (2 군간의 비교) 해서 비교를 한다면 어떠한 방법이 가능할 지 설명하고 R commander를 이용해서 분석을 실시하시오.
을 R commander를 이용해서 실시하고 결과를 해석하시오 군의 glucose값을 비교한다면 귀무가설과 대립가설이 무엇인지를 식으로 정확히 표현하시오. 3.4 R commander를 이용한 ANOVA를 실시하고 그 결과를 해석하시오. 3.5 사후분석을 실시해서 군간의 차이를 설명하시오 3.6 conc=1,2 를 한 그룹으로 conc=4,5 를 다른 그룹으로 (2 군간의 비교) 해서 비교를 한다면 어떠한 방법이 가능할 지 설명하고 R commander를 이용해서 분석을 실시하시오.")
21
ANOVA Effect of glucose concentration on Insulin
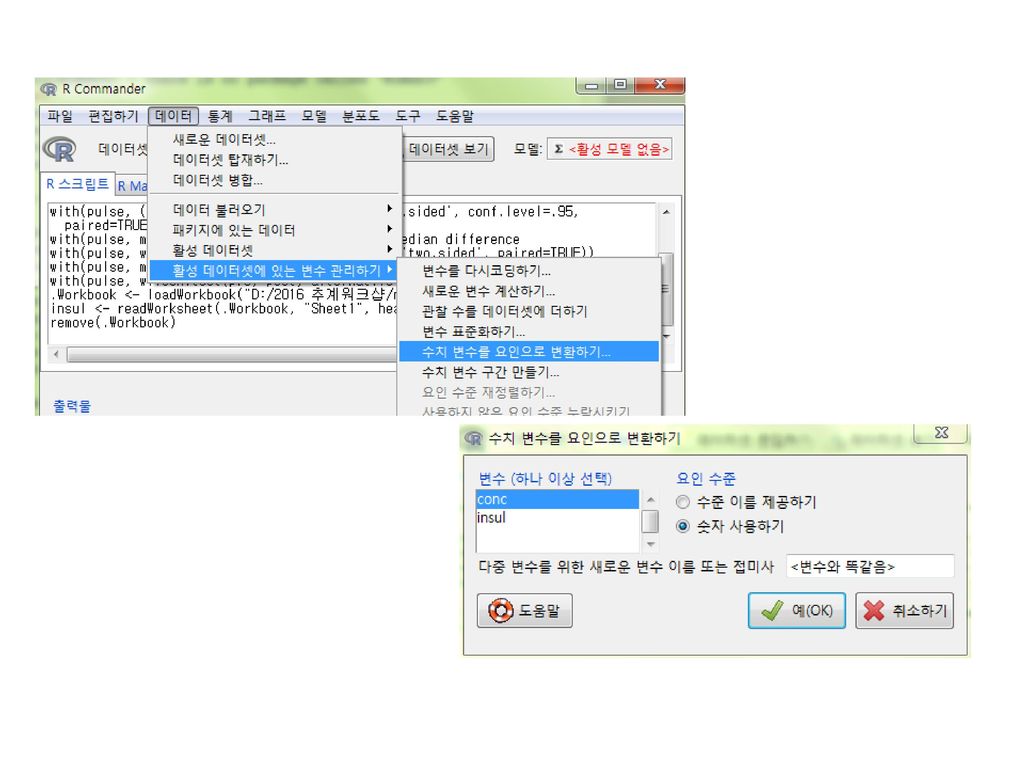
- insul data ANOVA Effect of glucose concentration on Insulin Measured the amount of insulin secretion after administration of five different concentrations of glucose into pancreatic tissue (animal experiments) Characteristics for each group Statistics > Summaries (according to the study objective) Graphs (according to the study objective) variable “conc” must be declared as a factor variable!
 Characteristics for each group. Statistics > Summaries (according to the study objective) Graphs (according to the study objective) variable conc must be declared as a factor variable!")
24
- insul data ANOVA Graphs->Boxplot Conc 1,2 < 3 < conc 4,5

25
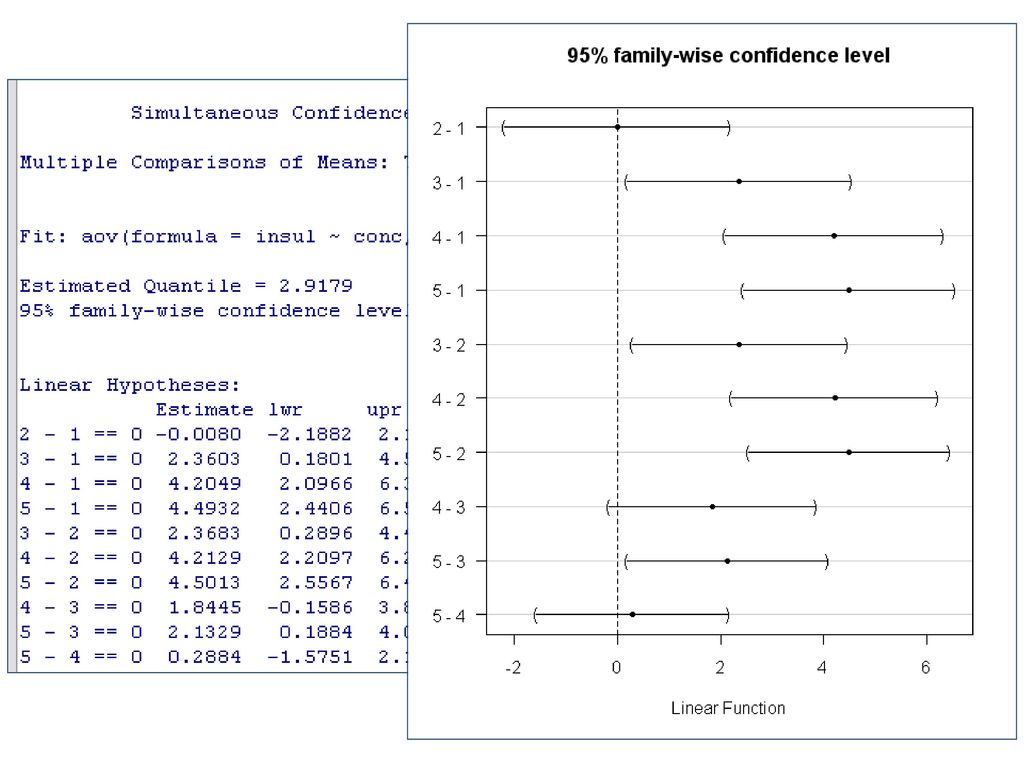
ANOVA One-Way ANOVA Pairwise comparisons of means
- insul data ANOVA One-Way ANOVA Statistics > Means > One-way ANOVA Pairwise comparisons of means Tukey post-hoc comparison procedure (default)
")
27
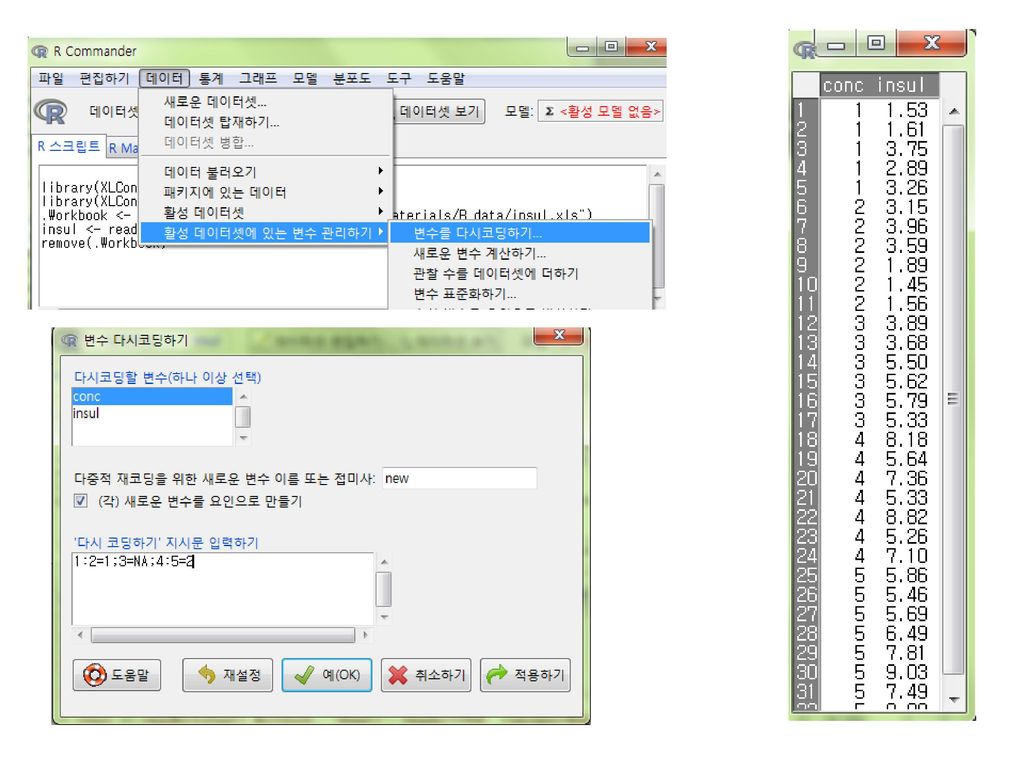
Multiple comparison t-test for (1,2) vs (4,5) comparison
- insul data Multiple comparison t-test for (1,2) vs (4,5) comparison Re-define variables Data > Manage variable in active data set > Recode variables > select conc variable New variable name or prefix for multiple recodes : new Enter recode directives 1:2=1; 3=NA; 4:5=2 conc=3 as a missing Equality of variance test should be carried out before the t-test Statistics > Variances > Two variances F-test the variances are equal Statistics > Means > Independent samples t-test Mean concentration difference between two new groups (variances are assumed to be equal) Significant
 vs (4,5) comparison. Re-define variables. Data > Manage variable in active data set > Recode variables > select conc variable. New variable name or prefix for multiple recodes : new. Enter recode directives. 1:2=1; 3=NA; 4:5=2. conc=3 as a missing. Equality of variance test should be carried out before the t-test. Statistics > Variances > Two variances F-test. the variances are equal. Statistics > Means > Independent samples t-test. Mean concentration difference between two new groups (variances are assumed to be equal) Significant.")
29
Statistics > Variances > Two variances F-test
- insul data Variance ratio test of the two groups Statistics > Variances > Two variances F-test

30
Independent samples t-test (equal variances)
- insul data Independent samples t-test (equal variances)
")
31
Multiple comparison(non-parametric)
- insul data Multiple comparison(non-parametric) Nonparametric way of comparing (1,2) vs (4,5) Statistics > Nonparametric tests > Two sample Wilcoxon test
 Nonparametric way of comparing (1,2) vs (4,5) Statistics > Nonparametric tests > Two sample Wilcoxon test.")
32
Characteristic of data
- taillite2 data Characteristic of data resptime(continounous) difference by Vehtype(dichotomous) variable=> Analysis of variance? Looking at only Group=1 variables features vehtype Vehicle type group Light On=1 Light Off=2 position Light Position speedzn Speed Zone resptime Response Time follotme Following Time in Video Frames folltmec Following Time in Categories
 difference by Vehtype(dichotomous) variable=> Analysis of variance Looking at only Group=1. variables. features. vehtype. Vehicle type. group. Light On=1. Light Off=2. position. Light Position. speedzn. Speed Zone. resptime. Response Time. follotme. Following Time in Video Frames. folltmec. Following Time in Categories.")
33
문제 4. 4. 1 taillite2. sav 자료를 읽고 이 자료의 분석 목적에 대해서 설명하시오. 4
문제 taillite2.sav 자료를 읽고 이 자료의 분석 목적에 대해서 설명하시오. 4.2 vehtype에 따른 resptime의 차이가 있는지를 ANOVA를 이용해서 검정하시오. 4.3 원자료의 정규성 검정을 실시하고 결론을 이야기하시오. 4.4 비모수적인 방법으로 vehtype에 따른 resptime의 차이가 있는지를 검정하시오. 4.5 로그변환을 실시하고 정규성 검정을 실시하시오. 4.6 로그변환 변수를 이용해서 ANOVA를 실시하시오 4.7 로그변환 후 비모수 검정을 실시하시오 와 와 4.7의 결과들을 비교 설명하시오

34
ANOVA Trying ANOVA Statistics > Means > One-way ANOVA
- taillite2 data ANOVA Trying ANOVA Statistics > Means > One-way ANOVA Response variable : resptime, Groups : vehtype Grouping variables should be converted as factor variables (Data > Manage variable in active data set > Convert numeric variables to factors) A significant difference between Vehtypes on resptime?
 A significant difference between Vehtypes on resptime")
35
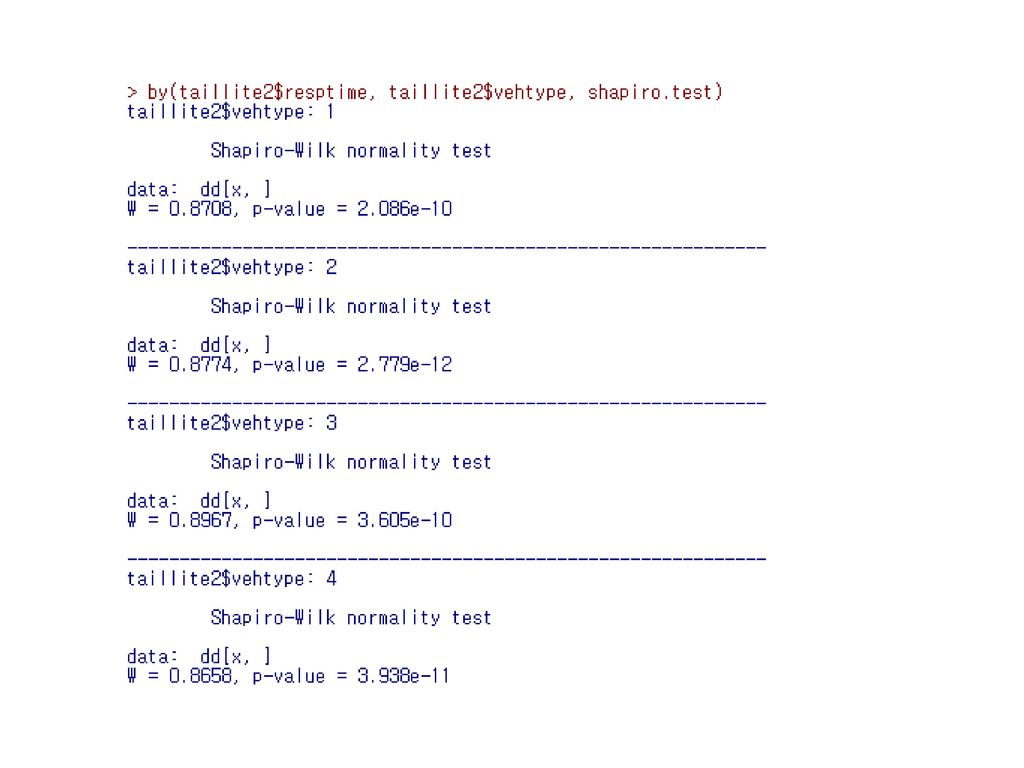
Normality test Normality test
- taillite2 data Normality test Normality test Statistics > Summaries > Shapiro-Wilk test of normality For normality test for Vehtype, by(taillite2$resptime, taillite2$vehtype, shapiro.test) Reject the null!! ANOVA can not be conducted.
 Reject the null!! ANOVA can not be conducted.")
37
Kruskal-Wallis test Trying nonparametric way (Kruskal-Wallis test)
- taillite2 data Kruskal-Wallis test Trying nonparametric way (Kruskal-Wallis test) Statistics > Nonparametric tests > Kruskal-Wallis test p=0.259 No difference between groups!
 Statistics > Nonparametric tests > Kruskal-Wallis test. p= No difference between groups!")
38
- taillite2 data Make new variable Data > Manage variable in active data set > Compute new variable New variable name : lresp Expression to compute : log(resptime)
")
39
Normality test for lresp
- taillite2 data Normality test for lresp Edit command line as by(taillite2$lresp, taillite2$vehtype, shapiro.test)
")
40
ANOVA Trying ANOVA with lresp p=0.063 What do you conclude?
- taillite2 data ANOVA Trying ANOVA with lresp p=0.063 What do you conclude?

41
Characteristic of data
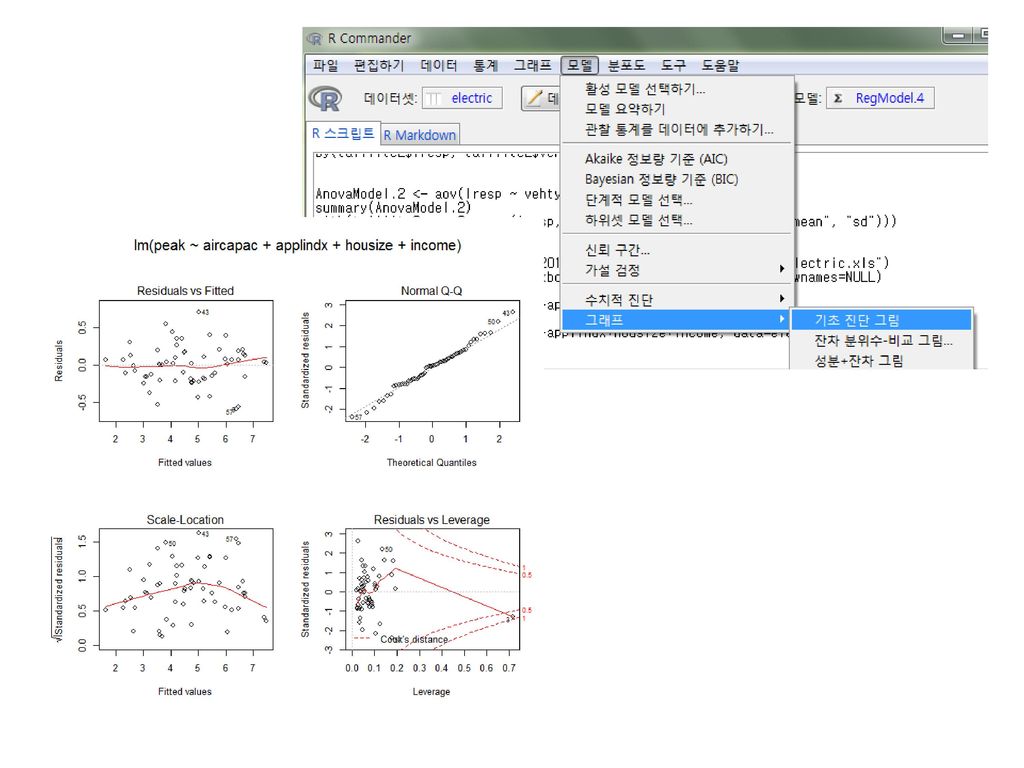
- elctric data Characteristic of data Aim: Selecting variables that affect the variable “peak” (Maximum amount of electricity) and finding the regression equation Statistics > Fit models > Linear regression Create command line first if you want to use the stepwise method for model selection (use step(model) function) variables features housize House Size income Family Income aircapac Air Conditioning Capacity applindx Appliance Index family Number of Family Members peak Peak Hour Electric Load
 and finding the regression equation. Statistics > Fit models > Linear regression. Create command line first if you want to use the stepwise method for model selection (use step(model) function) variables. features. housize. House Size. income. Family Income. aircapac. Air Conditioning Capacity. applindx. Appliance Index. family. Number of Family Members. peak. Peak Hour Electric Load.")
42
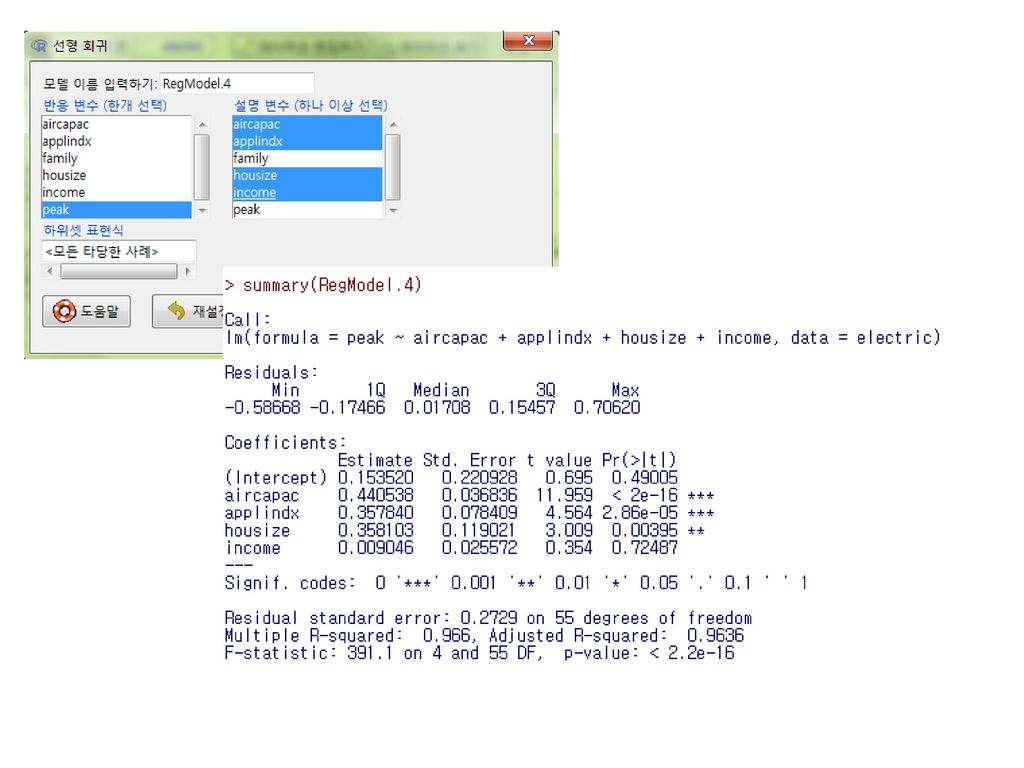
문제 5. 5. 1 eletric. xls 자료를 읽고 이 자료의 분석 목적에 대해서 설명하시오. 5
문제 eletric.xls 자료를 읽고 이 자료의 분석 목적에 대해서 설명하시오. 5.2 peak 를 종속변수로 해서 단계적 선택에 의한 회귀분석을 실시하고 해석을 하시오. (family 변수는 제외) Statistics -> Fit models -> Linear Regression
 Statistics -> Fit models -> Linear Regression")
45
3D graphics

46
Rcmdr R commander was developed as an easy to use graphical user interface (GUI) for R Rcmdr is not perfect yet, but has been updated Expecting menu screen in Korean and Korean fonts variability

Similar presentations
. 제 1 절. 보건통계의 정의 ▶ 보건통계의 의미 1. 지역사회나 국가의 보건 수준및 보건 상태 2. 보건사업의 필요성 결정 3. 보건입법을 촉구하며, 보건사업에 대한 공공지원을 촉진하게 할수 있음 4.>")


 문제 Machine Learning.>")
>")


 6:30-10:30 장소 : 삼성암센터 (지하1층 세미나실2)>")

>")

를 통하여 변수간의 차이를 비교할 때.>")

>")
 분산분석 이란? 여러 개의 모집단의 모평균을 비교하는 분석방법>")


 6:30-10:30 장소 : 삼성암센터 (지하1층 세미나실2)>")
 Department of Biostatistics, Samsung Biomedical Research Institute Samsung Medical Center.>")