Download presentation
Presentation is loading. Please wait.

1
4-4 Comparison of Standard Deviations with the F test

2
4-5 t Test with a Spreadsheet

3
4-6 Grubbs Test for an Outlier

4
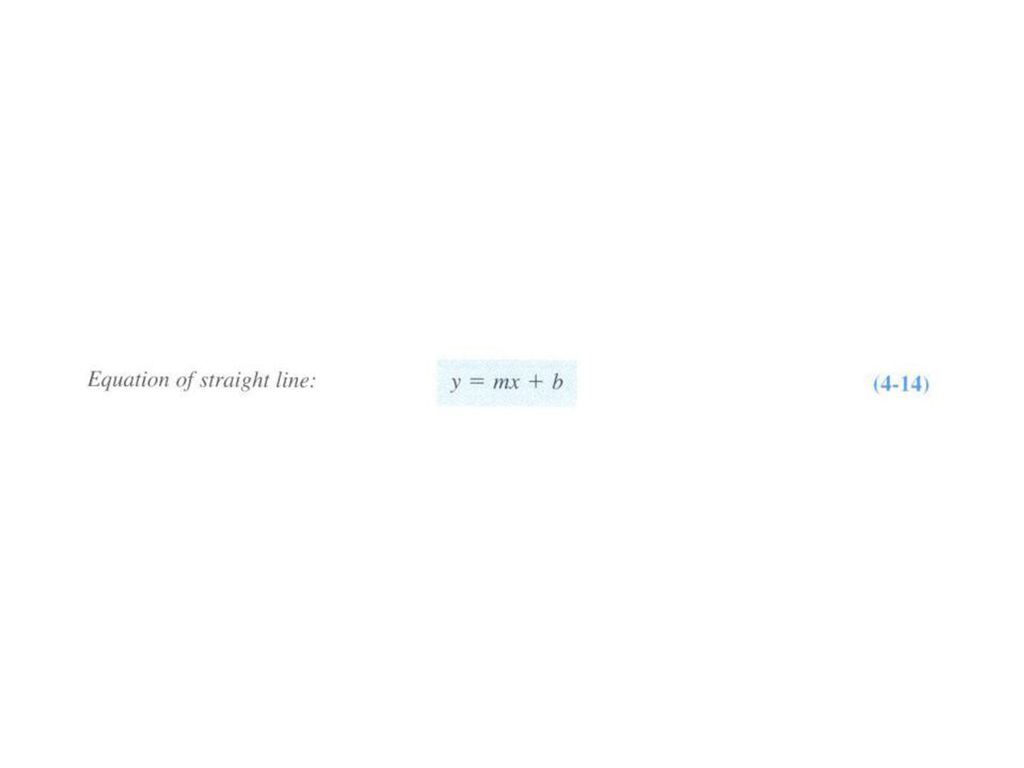
4-7 The Method of Least Square

6
Assumption of the Least-Squares Method

7
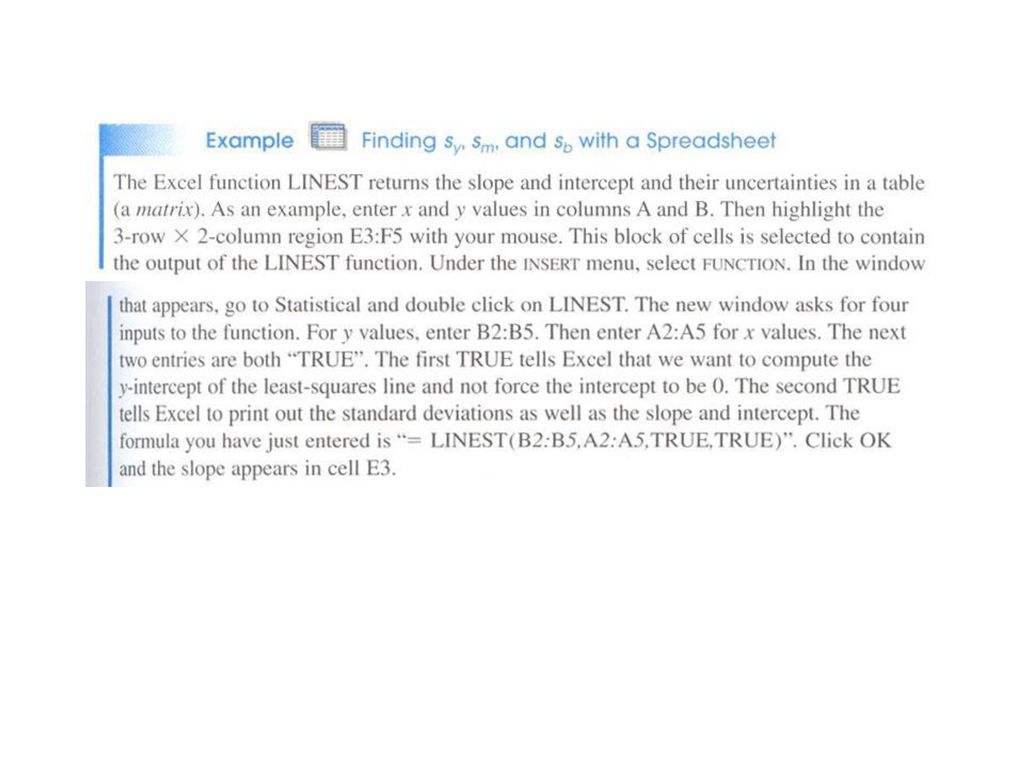
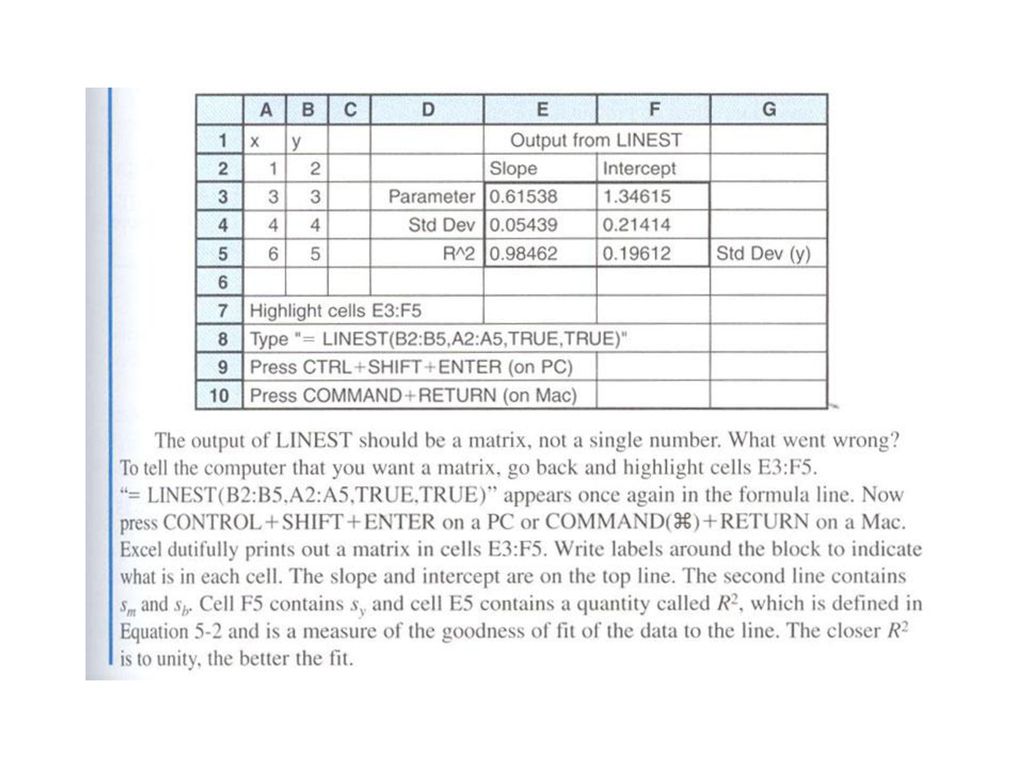
1. The slope of the line, m : 2. The intercept, b : 3. The standard deviation about regression, sr : 4. The standard deviation of the slope, sm : 5. The standard deviation of the intercept, sb : 6. The standard deviation for results obtained from the calibration curve, sc :

11
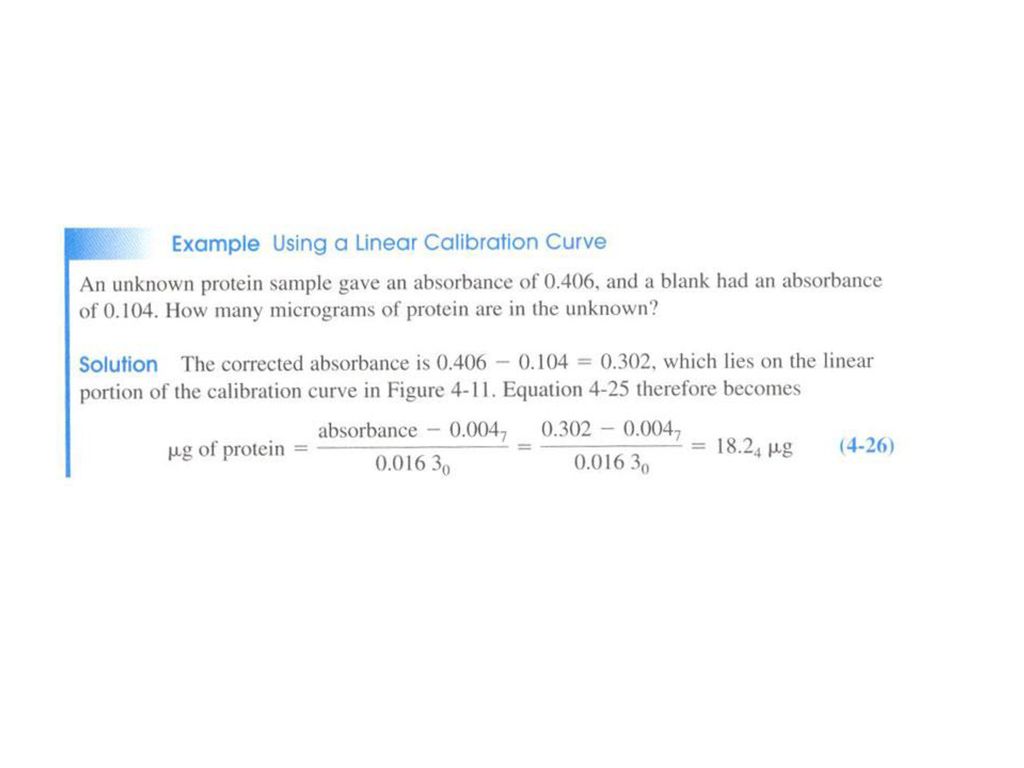
4-8 Calibration Curves

14
8D-2 Linear Dynamic Range
⇒ upper limit: 직선성으로 부터 5%의 deviation이 시작되는 곳 ⇒ 선형이 단순하고, 비이상적인 신호 검출이 용이하기 때문에 유리 함 → 비선형이 사용될 수도 있음 ⇒ 선형 측정범위가 큰 것이 좋음

15
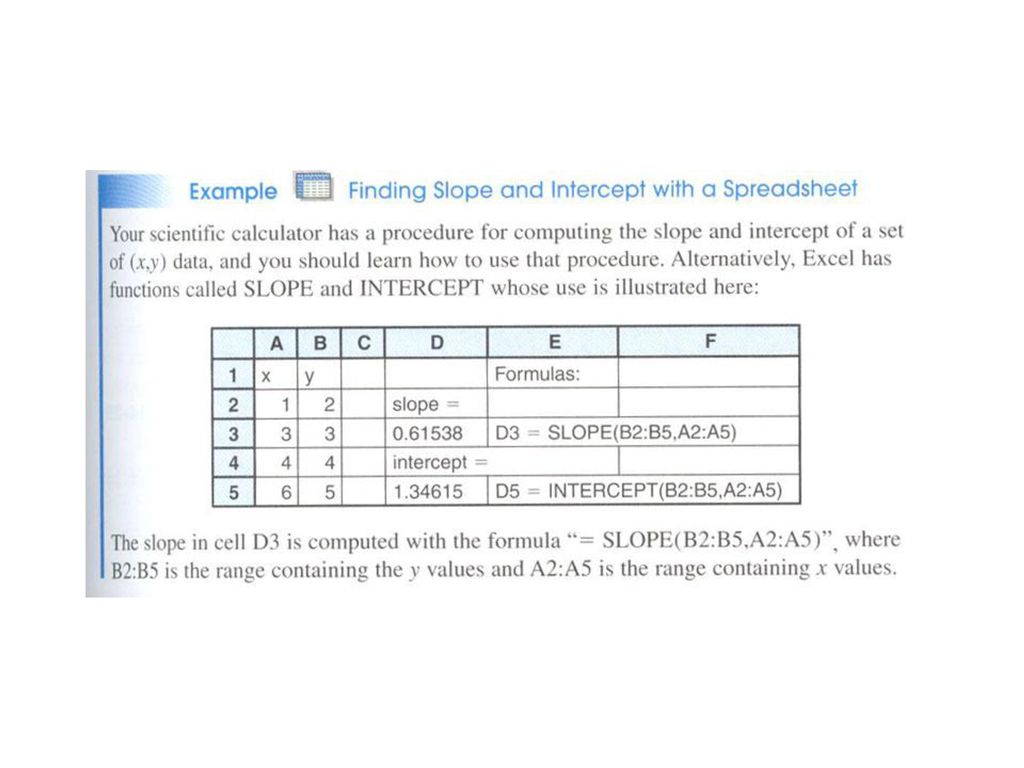
4-9 A Spreadsheet for Least Squares

Similar presentations


 양 지나.>")


재활용대안기업연합회 e - 뉴스레터 2010 (사)재활용대안기업연합회 정기총회 2월, 3월 HEADLINE NEWS>")


>")


 Department of Biostatistics, Samsung Biomedical Research Institute Samsung Medical Center.>")